Thoughts About Effects of Rising Interest Rates on CRE NAVs and Cap Rates
June 29, 2022 | James Sprow | Blue Vault
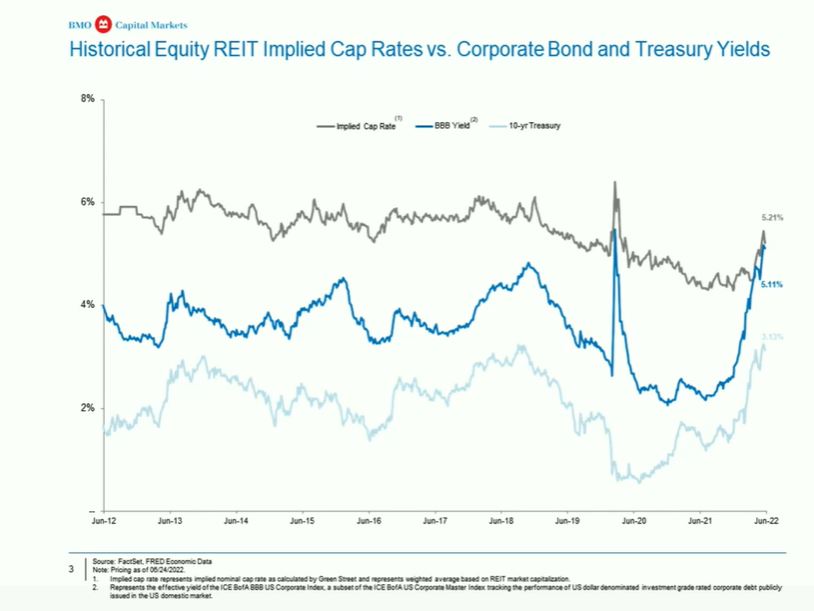
In this discussion, we focus on the effects of rising interest rates on the valuation of commercial real estate and we consider the lags in how the impacts are revealed. A recent webinar presentation by Bloomberg (6/29/22) included a chart from BMO Capital Market that displayed an interesting lag between the recent rise in 10-Year Treasury yields, BBB-rated bond yields, and implied cap rates for commercial real estate transactions. The chart showed the steep rises in the Treasury bond yields and the BBB-rated bond yields beginning in March 2022, but interestingly the implied cap rates did not respond as quickly, and revealed a delayed effect.
This lagged effect on cap rates has implications for the determination of net asset values for nontraded REITs. All of the continuously offered nontraded REIT programs currently publish their per share net asset values on a monthly basis. These NAVs then determine the offering prices for the REIT’s common stock during the following month. For example, the transaction prices for the shares of Blackstone REIT, the largest continuously offered nontraded REIT, for each share class of common stock for subscriptions accepted as of July 1, 2022, were equal to each class’s NAV per share as of May 31, 2022. There is a built-in lag in how the REIT’s shares are priced to investors.
In Blackstone’s filings, and in the filings of the other continuously offered nontraded REITs, they explain that their portfolios are appraised annually by a third-party appraisal firm. They also state, for example, that transactions or events that have occurred “since May 31, 2022” could have a material impact on their NAV per share. They then present a breakdown of the components of total NAV and NAV per share for the latest month. Included in each monthly report of the NAV estimates are the discount rates and exit capitalization rates used to value each property type’s cash flows using discounted cash flow methods. In a previous Blue Vault article, we discussed how small changes in the discount rates and exit cap rates can affect NAV estimates. In this article we discuss how the time lags which necessarily determine the offering prices of the REIT’s shares can also be important.
If cap rates do not move as quickly as market interest rates when those interest rates respond to moves by the Federal Reserve, then it may be reasonable to assume that market interest rates can serve as a useful predictor of future cap rates. Before proceeding, let’s look at how cap rates and discount rates are used. In simple terms, a cap rate is a required rate of return. Investors value the future cash flows they expect from an investment by dividing their cash flow forecast by their required or expected rate of return.
In a typical corporate finance course, a simple model is introduced early on to value a perpetual stream of cash flows. Called the “Gordon Model” after Professor Myron Gordon who used it in the 1950s, it couldn’t be any simpler:
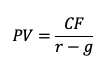
The equation represents today’s value “PV” based upon the cash flows expected from an investment as “CF” and the required or expected rate of return from that investment as “r”. The “g” in the equation is an adjustment for the expected growth in the cash flows. This equation elegantly and simply illustrates the three factors that determine the value of an investment and can apply well to valuing commercial real estate.
Think of “r-g” as a cap rate. Applied to the NOI or net operating income from a real estate investment, it means that other things equal, the higher the NOI or the lower the cap rate, the more valuable the property. The Gordon Model includes “g” which means the greater the expected growth in NOI, the lower the cap rate can be, and the more valuable the investment.
Perhaps we can explain the lags in the way implied cap rates respond to increasing interest rates by suggesting that higher expected future growth rates in NOI can compensate for the higher cost of capital implied by rising interest rates. We don’t think that is a reasonable assumption. While it could be true in some sectors, like multifamily, where rising rents have more than compensated for inflation and the impact inflation has on nominal required rates of return, it is unlikely to be generally true across all commercial real estate types.
Implications for Investors of Lags in Cap Rate Adjustments
If we assume that appraisals of commercial real estate values are predominately backward-looking, based upon transactions in the past that form the basis of “comparable sales,” we know that there should be lags in adjustments to real estate valuations. If appraisers also consider discounted cash flows, such as NOI, those cash flow estimates are also backward-looking. Consider that the accounting reports that measure NOI are typically released at least six weeks after the close of a quarter, and that the NOI measured in those reports is over the three-month periods prior to that six-week lag. This means that any valuation of commercial real estate based upon comparable sales or discounted cash flows is likely to be “old news.”
An investor in continuously offered nontraded REITs is going to pay for shares based upon the previous month’s NAV per share. Consider that the previous month’s NAV per share is “old news” and cannot possibly reflect a market value as of the date the shares are offered for subscription.
In a commercial real estate market where values are increasing an investor is likely to receive a bargain price, as the price per share is lagging the actual value of the equity portion of the REIT’s portfolio value. Conversely, when market prices for commercial real estate are falling, an investor who pays for shares based upon the NAV from the prior month is potentially over-paying. This is not to say that paying last month’s NAV for shares this month is a bad investment when market prices are falling, but simply that the lags in calculating NAVs are creating a situation where investors may pay more than they would prefer.
Supply and Demand
There are many factors to consider when analyzing real estate values, and by far the most important determinants of relative values are the basic economics of supply and demand.
The basics of ECON 200 are being played out in several markets currently. Multifamily properties and single-family homes have recently experienced double-digit price increases and rental rate increases at rates that haven’t been seen in the lifetimes of many property owners and tenants. The evidence is strong that the supply of housing units has not kept up with demand. Estimates of the gap in housing units in the U.S. run from 3 million to 5 million, meaning those who need housing are having to raise their offers, both in the single-family markets and the multifamily rental markets. Reports that renters are having to offer a higher rent than landlords are asking just to secure an apartment are now a reflection of the imbalance between supply and demand. This type of imbalance is not likely to be of short-term duration. Looking at the permitting activity in the U.S. for housing units, it will probably take years to achieve any semblance of balance.
How does this impact the NAV’s of REITs that invest in multifamily properties or single-family rentals? The “g” in the Gordon Model means that higher growth expectations for NOI can result in cap rates (“r-g”) that remain low, even as the cost of capital as reflected in market interest rates increases.
Conclusions
Cap rates are an important input to models that value commercial real estate and determine the monthly NAVs per share that are used to price common stock subscriptions for the continuously offered nontraded REITs. It is reasonable to assume that changes in NAVs will lag the changes in market values of real estate. Cap rates should be lower for real estate assets that have higher expectations for growth in NOI, other things equal. Two examples of those sectors in which this may be true today are multifamily and single-family rentals.
Sources: Blue Vault, BMO Capital Markets in a Bloomberg Webinar 6-29-22