The Importance of MFFO in Assessing Nontraded REIT Performance
June 28, 2022 | James Sprow | Blue Vault
Most investors in nontraded REITs correctly focus their attention on cash flows, or more specifically the cash distributions the REITs pay and whether they are sustainable. Unfortunately, the basic REIT financial statements prepared according to Generally Accepted Accounting Principles (GAAP) don’t provide sufficient information to answer the investor’s most basic questions about cash flow and distribution sustainability.
Historically, “Life Cycle” nontraded REITs went through a cycle of fundraising, portfolio construction, property management, and eventual liquidation. That life cycle, together with the unique characteristics of real estate accounting, means traditional accounting measures such as Net Income and earnings per share (EPS) can’t be relied upon to answer questions about distribution sustainability. As the industry evolved, companies recognized the shortcomings of GAAP in measuring cash flows available for distributions, and some REITs began reporting additional measures: funds from operations (FFO), modified funds from operations (MFFO), and adjusted funds from operations (AFFO). Initially, not all companies used the same definitions for these metrics, making apples-to-apples comparisons difficult. In 2010, IPA1 issued guidelines for calculating MFFO to standardize its reporting. Today, many nontraded REITs report their MFFO consistent with those IPA guidelines2. Blue Vault notes in every quarterly report whether the nontraded REIT is following IPA guidelines in calculating MFFO. If not, we make required adjustments to FFO to arrive at MFFO following those guidelines. There is also a trend among the currently active nontraded REITs to report AFFO3 rather than MFFO.
To calculate MFFO, an analyst begins with the REIT’s funds from operations (FFO). Every nontraded REIT reports FFO. FFO measures cash flow from a specified list of activities. FFO reflects the impact from the REIT’s leasing and acquisition activity, as well as interest costs. FFO takes into account the REIT’s net income including amortization and depreciation, but it excludes the capital gains from property sales. The reasons these gains are not included is that they are one-time events and generally do not have a long-term effect on the REIT’s future earnings potential.
The formula for FFO is:
FFO = net income + amortization + depreciation – capital gains from property sales
From the reported FFO the MFFO can be calculated if it is not included in the REIT’s financial reports. Basically, MFFO adjusts FFO for a full list of other non-cash impacts on GAAP Net Income, either because the GAAP numbers do not represent cash flows but are accrued entries, or because they are considered to have one-time impacts and no ongoing effects on funds available for distributions.
FFO goes part way to the measurement of funds available to pay distributions, but there are still many non-cash items within GAAP Net Income that require adjustments. These include such things as “straight-line rent” which GAAP requires to average escalating lease revenue over the life of the lease; amortization of above-market rents; impairments which are write-downs of asset values; gains or losses on securities and foreign exchange; and expenses related to acquisitions and dispositions which are not expected to recur. After these adjustments, which are defined by IPA, we arrive at MFFO. While not a perfect metric, MFFO gives investors a better idea of the cash flows being generated by a nontraded REIT that can, in the long run, be available for cash distributions.
When cash distributions exceed MFFO, they cannot be sustained for long. When MFFO exceeds cash distributions, the distributions can be sustained. The trends in MFFO are important. Over the life of the nontraded REIT, this number can make the difference between a healthy investment and an inferior performance.
Blue Vault’s MFFO Metrics
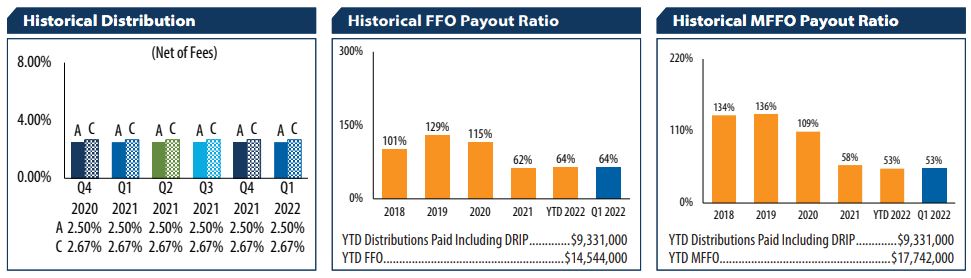
In every quarterly NTR report, we report the REIT’s MFFO payout ratio for each of the most recent five years as well as the current year’s YTD and most recent quarter’s ratios. Those payout ratios reveal the trend in MFFO relative to distributions. Investors and potential investors can use the trends in MFFO payout ratios to determine if the recent distribution rates are likely to be maintained4.
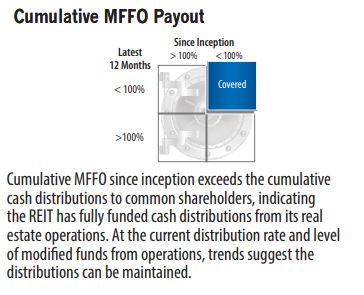
Also, we look at MFFO with a useful metric that compares MFFO to cash distributions, excluding the portion of distributions that are reinvested. By excluding reinvested distributions, we focus on just the distributions that require cash flows from the REIT’s operations. We use the REIT’s MFFO payout ratio over the last 12 months as the most recent measure of cash flows that sustain cash distributions, and the MFFO payout ratio since inception that measures the REIT’s performance over its total life. We compare cash distributions to MFFO and report whether the ratios are less than 100% for either time period or both.
REITs may pay distributions early in their lives that exceed MFFO, but we know that over time that payout must eventually be supported by MFFO to be sustainable. Well-managed nontraded REITs relatively quickly reach a level of MFFO that can support their distributions. During the pandemic many nontraded REITs either reduced their distribution rates or temporarily suspended distributions. The resulting MFFO payout ratios went down or were effectively zero. As those REITs recover from the impacts of the pandemic, they should return to generating sufficient MFFO to resume distributions or increase distribution rates. MFFO payout ratios will for those REITs once again be a useful indicator of financial health and stability.
Conclusion
Among the many metrics that analysts can use to measure the performance of nontraded REITs, MFFO is certainly one of the most useful. MFFO payout ratios are an excellent indicator of the ability of the REIT to produce and sustain cash flows for distributions. The trends in MFFO payout ratios are important in assuring investors that distributions will continue. Blue Vault’s Nontraded REIT Full-Cycle Performance studies reveal that distributions make up a large portion of the total returns to shareholders in nontraded REITs and MFFO trends are a key indicator of the reliability of those returns.
Footnotes:
1. Institute for Portfolio Alternatives
2. MFFO = FFO + Adjustments for:
(a) acquisition fees and expenses; (b) straight-line rent and amortization of above or below intangible lease assets and liabilities; (c) amortization of discounts, premiums and fees on debt investments; (d) non-recurring impairment of real estate-related investments; (e) realized gains (or losses) from the early extinguishment of debt; (f) realized gains (or losses) on the extinguishment or sales of hedges, foreign exchange, securities and other derivative holdings, except where the trading of such instruments is a fundamental attribute to such Person’s business; (g) unrealized gains (or losses) for fair value adjustments on real estate securities, including commercial mortgage-backed securities and other securities, interest rate swaps and other derivatives not deemed hedges and foreign exchange holdings; (h) unrealized gains (losses) from the consolidation from, or deconsolidation to, equity accounting; (i) adjustments related to contingent purchase price obligations; and (j) adjustments for consolidated and unconsolidated partnerships and joint ventures.
3. Though there is no one official formula, calculations for AFFO typically would be something like:
AFFO = FFO + rent increases – capital expenditures – routine maintenance amounts
4. These MFFO examples are for Corporate Property Associates 18 – Global, Inc. for Q1 2022.