Introducing the Blue Vault DST Performance Tracker: A New View of Historical DST Performance
Today’s DST Market. Yesterday’s Performance. One Dashboard.
Blue Vault’s new DST Performance Tracker brings historical closed and full-cycle DST performance information together in one convenient view, connecting sponsor track records with today’s DST marketplace.
Looking Beyond Today’s DST Offerings
When evaluating a Delaware Statutory Trust (DST) investment, wealth advisors naturally focus on the details of the offering available today.
Projected distributions, leverage, property characteristics, acquisition costs, and potential exit strategies are all important considerations.
But what about the DST programs that came before it?
How many of a sponsor’s previous DST programs are performing as projected? How many have completed their investment cycle? What happened when the underlying properties were sold? And how does one sponsor’s historical performance compare with another’s?
These are important questions when evaluating a DST sponsor’s experience and track record.
That’s why Blue Vault has introduced the Blue Vault DST Performance Tracker, a signature feature within our new Blue Vault DST Intelligence Dashboard.
Introducing the Blue Vault DST Performance Tracker
For years, Blue Vault has collected and analyzed information on alternative investments, has recently launched a platform to track closed and full-cycle DST programs.
Now, the DST Performance Tracker brings important historical performance measures together in a single comparative view, making it easier for industry professionals to examine sponsor histories and identify areas for further due diligence.
Source: Blue Vault’s Alts Intelligence Portal. Figures and row order reproduce the supplied updated Tracker screenshot. All five displayed sponsors have the same full-cycle sales-price break-even percentage; their order does not indicate overall sponsor quality. Coverage and reporting periods may vary. Sales-price break-even measures are not total investor returns. Historical performance does not guarantee future results.
The Tracker includes five key areas of intelligence:
1. Full-Cycle DST Programs
The number of DST programs a sponsor has brought through the full investment cycle.
2. Full-Cycle Sales Performance
The percentage of a sponsor’s full-cycle DST programs that achieved at least a break-even result based on property sales price.
3. Closed DST Program Performance
The percentage of a sponsor’s evaluated closed DST programs currently paying distributions at or above their projected levels.
For Blue Vault’s analysis, a closed DST program is classified as performing when actual distributions are at or above projected distributions. The percentage reflects the share of evaluated closed programs meeting that standard, rather than the percentage of invested equity.
4. UPREIT Information
Available information on sponsors’ UPREIT vehicles, including distribution coverage ratios, providing additional context for evaluating sponsors with UPREIT structures.
5. Currently Open DST Programs
The number of DST offerings each sponsor currently has open.
Through the broader Blue Vault Intelligence platform, eligible industry professionals can access additional offering-level information, including projected distributions, leverage, property characteristics, and other important investment metrics.
Together, these measures provide a more comprehensive perspective on a sponsor’s historical experience and current market activity.
Why Closed and Full-Cycle Performance Matters
Projected performance reflects what a sponsor expects an investment to deliver.
Historical performance helps reveal what previous programs have actually delivered.
Closed and full-cycle DST programs provide different, but complementary, perspectives on that history.
Closed DSTs: Are Programs Meeting Distribution Projections?
A closed DST has completed its offering period but has not necessarily reached the end of its investment cycle.
These programs may continue operating for years, making ongoing distribution performance an important measure to monitor.
Blue Vault evaluates whether closed DST programs are currently paying distributions at or above their projected levels.
By presenting the percentage of closed DST programs performing, the Tracker helps industry professionals understand how frequently a sponsor’s evaluated programs are meeting distribution expectations.
A program’s current distribution performance does not, by itself, establish its overall investment performance or predict its eventual outcome.
Full-Cycle DSTs: What Happened When the Investment Cycle Ended?
Full-cycle DST programs have completed their investment cycle, providing an additional opportunity to examine historical results.
One measure tracked by Blue Vault is the percentage of full-cycle programs achieving at least a break-even result based on property sales price.
This offers perspective on how the underlying properties performed upon disposition.
Importantly, a property achieving a break-even sales-price result does not necessarily mean investors recovered their entire investment or earned a positive total return. Investor outcomes depend on additional factors, including financing, expenses, distributions received, and net proceeds.
By examining closed and full-cycle information together, industry professionals can develop a broader understanding of a sponsor’s historical record.
Making Historical DST Intelligence More Accessible
Historical DST performance information can be difficult to assemble and compare.
A wealth advisor evaluating multiple DST sponsors may need to review numerous offering documents and historical disclosures to understand previous program performance.
Even when that information is available, comparing different sponsors and programs can require considerable time and effort.
The Blue Vault DST Performance Tracker is designed to simplify that process.
Rather than examining each sponsor’s historical information separately, users can access a comparative view featuring consistent performance measures across the sponsors covered by Blue Vault.
The result is a more convenient starting point for evaluating sponsor histories, understanding historical performance patterns, and identifying questions that warrant additional research.
The Tracker does not assign sponsors an overall rating or recommend particular investments. Its purpose is to provide factual information that supports informed due diligence.
From the Big Picture to the Details, Seamlessly
The DST Performance Tracker is one component of the broader Blue Vault DST Intelligence Dashboard.
The Dashboard provides industry professionals with a visual overview of the DST marketplace, including market trends, offering characteristics, and available historical performance information.
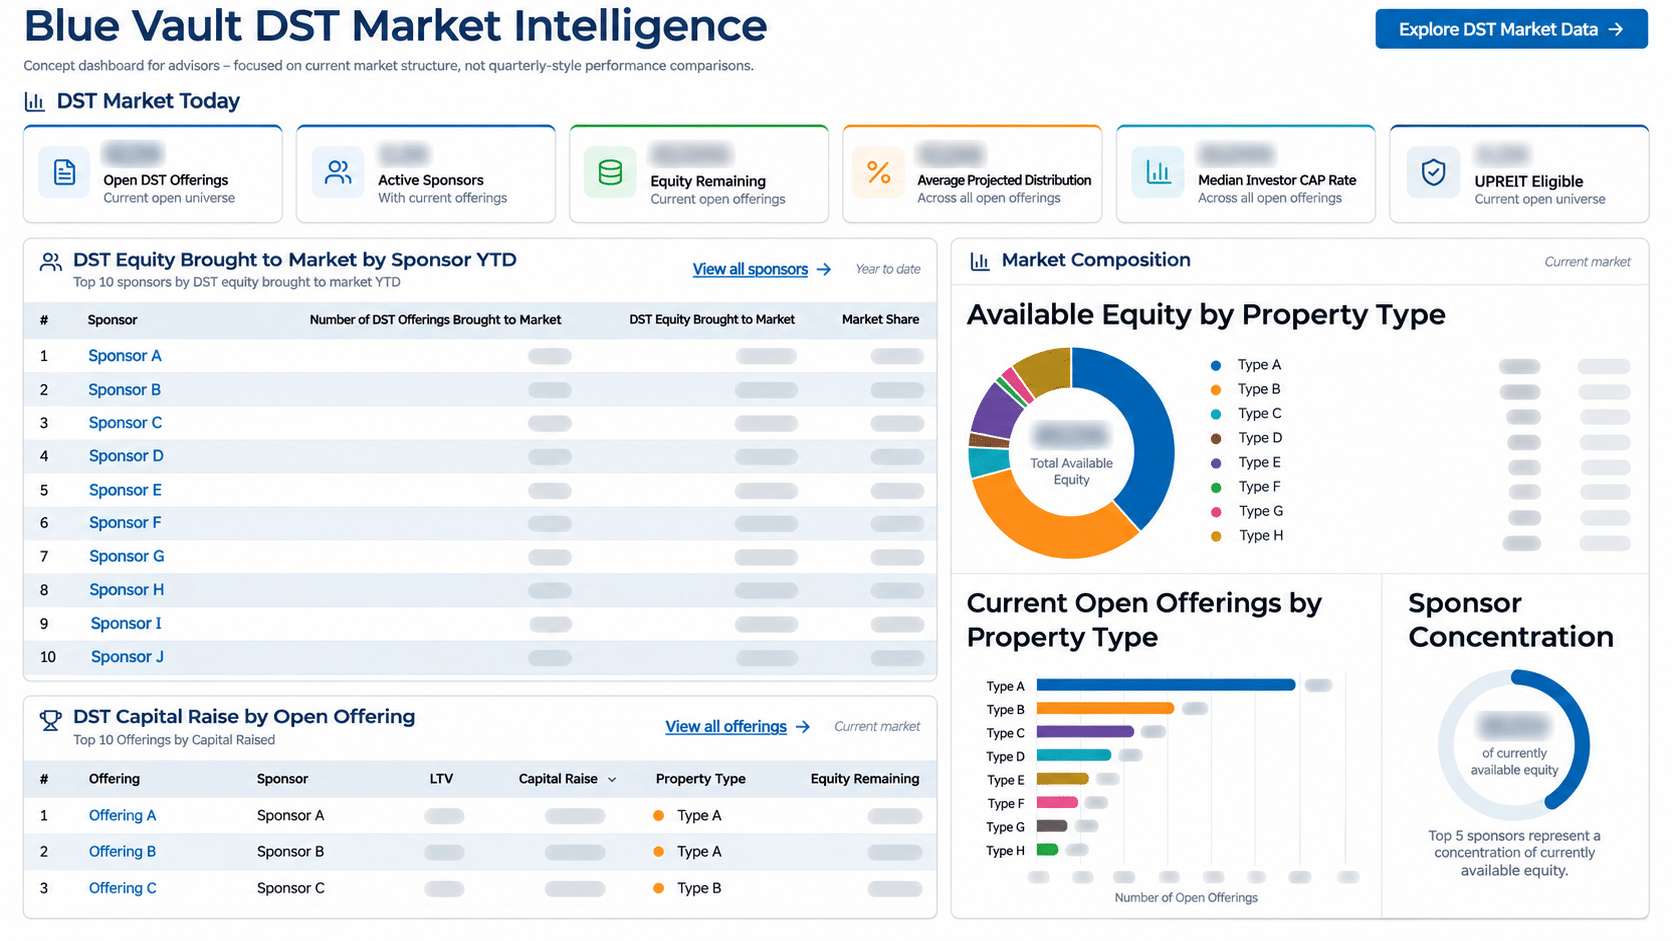
Source: Blue Vault’s Alts Intelligence Portal. Illustrative, cropped dashboard preview with placeholder sponsor and offering labels and selected values obscured. This image shows part of the Dashboard and is not a presentation of current offering-level data. Select the image to enlarge it.
Users can transition from the Dashboard into detailed underlying data tables covering open, closed, and full-cycle DST programs.
For currently open offerings, Blue Vault Intelligence provides access to extensive information, including projected distributions, loan-to-value ratios, property types, offering structures, and other important investment characteristics.
For closed and full-cycle programs, users can explore historical information that helps put a sponsor’s current offerings into perspective.
The Dashboard provides the big picture. The underlying data tables provide the details.
Together, they allow industry professionals to explore today’s DST marketplace alongside the historical record of participating sponsors.
A New Resource for DST Due Diligence
The introduction of the DST Performance Tracker represents an important step in Blue Vault’s ongoing efforts to make DST market and historical performance intelligence more accessible.
For wealth advisors, historical sponsor information can help inform due diligence and provide additional context when evaluating current investment opportunities.
For broker-dealers and other industry professionals, comparative historical performance measures can support sponsor research, product reviews, and broader market analysis.
And for DST sponsors, the availability of historical performance information reinforces the importance of transparency and maintaining a meaningful record of previous programs.
While historical performance cannot predict future investment results, understanding a sponsor’s past programs can provide valuable perspective when evaluating its experience.
Continue the Analysis in Blue Vault.
Explore the New Blue Vault DST Performance Tracker
The Blue Vault DST Performance Tracker is now available within the Blue Vault DST Intelligence Dashboard.
Explore historical closed and full-cycle DST performance, compare sponsor track records, and transition seamlessly into detailed DST intelligence.
Today’s DST Market. Yesterday’s Performance. One Dashboard.
Blue Vault Intelligence subscriptions are free for wealth advisors. Access to detailed offering-level intelligence is intended for eligible industry professionals.
Sources & Methodology
Source: Blue Vault’s Alts Intelligence Portal.
Closed DST performance: Blue Vault classifies a closed DST program as performing when actual distributions are at or above projected distributions. The Tracker reports the percentage of evaluated closed DST programs meeting that criterion, based on program counts rather than invested equity.
Full-cycle performance: Sales-price break-even measures reflect comparisons of property sales results and are not equivalent to total investor returns.
Data availability: Historical information is based on information available to Blue Vault. Coverage, reporting periods, and completeness may vary by sponsor and program.
Investment considerations: Historical performance does not guarantee future results. The Tracker is intended to support research and due diligence and should not be interpreted as a sponsor rating, investment recommendation, or prediction of future performance.
Originally published on bluevaultpartners.com.